
Transport for London: The Backbone of Transit, Street and Service Reporting
Transport for London (TfL) operates the city’s buses, Tube, trams, river services, roads and cycling infrastructure. This reference page explains how TfL functions as a primary source for transit data, street management and service-quality reporting, with special attention to its open data programme.
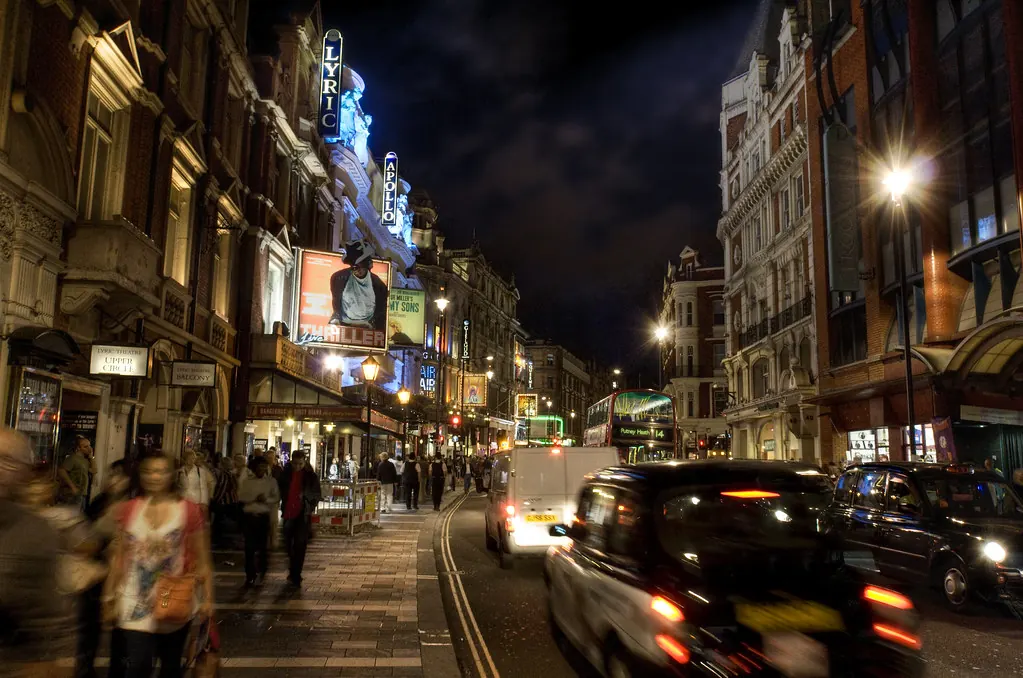
Transport for London (TfL) is the integrated transport authority responsible for the capital’s public transport network, main roads and strategic streets. For anyone reporting on London’s urban environment — from housing and planning to public realm and mobility — TfL is an indispensable source of operational data, policy documents and real-time service information.
This reference page outlines what TfL covers, how to access its open data, and how to use its outputs responsibly for transit, street and service-quality reporting. All details are anchored to the official TfL website and its open data portal. Readers should verify current figures and project statuses directly on those platforms.
What TfL Covers
TfL’s remit is broader than many people realise. It does not just run the Tube. The authority manages:
- London Underground, London Buses, London Trams, Docklands Light Railway (DLR), London Overground, Elizabeth line and Emirates Air Line (cable car).
- London’s main roads (the TLRN — Transport for London Road Network), including traffic signals, street lighting and roadworks coordination.
- Cycling infrastructure, including Cycleways, Santander Cycles hire scheme and bike parking.
- Taxi and private hire licensing (via TfL’s licensing function).
- Congestion Charge, Ultra Low Emission Zone (ULEZ) and Low Emission Zone enforcement.
- River services (London River Services) and the Woolwich Ferry.
- Dial-a-Ride and other door-to-door services for disabled or older people.
Each of these areas produces data and reports that can support investigative or explanatory stories about how London moves.
Finding Official Service Data
TfL publishes regular performance data on its website. Key datasets include:
- Tube performance: percentage of trains arriving on time, customer satisfaction scores and reliability metrics by line.
- Bus performance: excess wait time, scheduled vs actual journeys and passenger numbers.
- Road network data: traffic flow, journey time reliability and collision statistics.
- Cycle hire data: number of hires, station availability and docking station utilisation.
These are available through the main TfL site under “Reports and publications” and via the open data portal. For the most current figures, always check the date of the last update and note that some datasets are released quarterly or annually.
| Dataset | Frequency | Typical use case |
|---|---|---|
| Tube performance data | Monthly | Reporting on line delays or service improvements |
| Bus excess wait time | Weekly/monthly | Assessing bus reliability in specific boroughs |
| Road traffic flow | Annual | Comparing congestion before/after ULEZ expansion |
| Cycle hire usage | Daily (API) | Tracking seasonal trends in active travel |
| Collision data | Annual | Mapping safety issues at specific junctions |
Using TfL Open Data
TfL’s open data programme is one of the most comprehensive of any transport authority in the world. It provides free, machine-readable data via APIs and bulk downloads. The programme is designed for developers, researchers and journalists.
To access the data, you need to register on the TfL Open Data portal and agree to the terms of use. The portal offers:
- Unified API: provides real-time and scheduled data for Tube, bus, tram, DLR, Overground and Elizabeth line services. Data includes arrival predictions, line status, service disruptions and station facilities.
- Bulk datasets: for historical analysis, including journey counts, fare data and road network geometry.
- Maps and GIS files: for spatial analysis of routes, stations, cycleways and charging zones.
When using TfL open data in reporting, note the following:
- Real-time data is updated every 30–60 seconds for most services, but delays in propagation are possible.
- Historical datasets may have a lag of several months before publication.
- The API documentation and licensing terms are available on the open data portal. Always cite TfL as the source and include the date the data was accessed.
Street and Service-Quality Reporting
TfL is a primary source for stories about street conditions and service quality. Journalists and analysts can use its data to investigate:
- Potholes and road defects: TfL manages road repairs on the TLRN. Reports from the public are handled through the TfL website or the “Report a problem” tool. Data on repair times and backlog is sometimes published in annual reports.
- Bus stop and shelter maintenance: TfL publishes service standards for bus stops, including cleanliness and shelter condition. Performance against these standards is reported quarterly.
- Accessibility: TfL provides station accessibility data, including step-free access, platform gaps and staff assistance availability. This is available via the API and as a downloadable CSV.
- Air quality: TfL operates monitoring stations on the road network and publishes data on nitrogen dioxide and particulate matter levels. This is often used in stories about ULEZ effectiveness and school run pollution.
- Service disruption reporting: TfL’s “Status updates” page and API provide real-time information on closures, delays and planned engineering works. This is essential for reporting on travel disruption.
| Reporting topic | TfL source | Data format |
|---|---|---|
| Bus stop cleanliness | Service standards report | PDF or CSV |
| Step-free station access | Station accessibility data | API or CSV |
| Road repair times | Annual road maintenance report | |
| Real-time Tube delays | Line status API | JSON |
| Air quality near schools | Air quality monitoring data | CSV or GIS |
Practical Tips for Journalists and Researchers
When using TfL as a source, follow these guidelines to ensure accuracy and credibility:
Always verify the date. TfL datasets are timestamped. Using outdated data can lead to incorrect conclusions.
2. Cite the specific source. Instead of “TfL data shows…”, say “TfL’s excess wait time data for January 2025 shows…”. This allows readers to check your claim.
3. Be aware of revisions. TfL may revise historical data after initial publication. Check for updates before republishing a statistic.
4. Respect licensing terms. TfL open data is free to use, but you must attribute TfL and not present the data as your own. Commercial use may require additional permission.
5. Cross-reference with other sources. For street-level stories, combine TfL data with borough council data or direct observation. TfL does not manage all London roads — boroughs are responsible for local streets.
6. Use the API responsibly. If you are scraping or making frequent API calls, follow TfL’s rate limits and terms of use to avoid being blocked.
Sources and limits
This reference page is based on the following official sources:
- Transport for London: https://tfl.gov.uk/
- TfL Open Data: https://tfl.gov.uk/info-for/open-data-users/
All details about TfL’s remit, data availability and licensing terms are drawn from these sources as of the date of publication. TfL may update its website, change data formats or revise its open data policy. Readers should consult the official sources for the most current information. This page does not provide legal advice on data licensing or copyright.
Fuentes
- [{"name": "Transport for London", "url": "https://tfl.gov.uk/"}, {"name": "TfL Open Data", "url": "https://tfl.gov.uk/info-for/open-data-users/"}]
Historial de cambios
Ultima revision y actualizacion: 31 July 2026.
Latest related updates

Record Campaign Spending in Washington State Prompts Questions About Money in Local Planning Politics
A Seattle specialist outlet reports unprecedented corporate and billionaire spending ahead of the 2026 US midterms, including a Microsoft-backed PAC targeting a…
Read update
Post-storm waste collection is a resilience test London boroughs cannot schedule
A look at how two US cities treated storm debris clearance as a pre-planned system rather than an emergency scramble, and what…
Read update
Chicago’s sewage overflows are a warning for London’s combined sewers
Chicago's Racine Avenue pumping station has discharged more than 10 billion gallons of combined sewage into the Chicago River this year, despite…
Read update
St. Louis bets on conversions and innovation zones for its downtown: the test London has already run
St. Louis is leaning on office-to-residential conversions, innovation zones and private-sector partnerships to revive its urban core. The instruments are familiar in…
Read update