
Transport for London as a Source for Transit, Street and Service-Quality Reporting
Transport for London is one of the most comprehensive urban data providers in the world. This reference page explains how journalists, planners and researchers can use TfL’s public data, open APIs and official reports to track transit performance, street conditions and service quality across London.
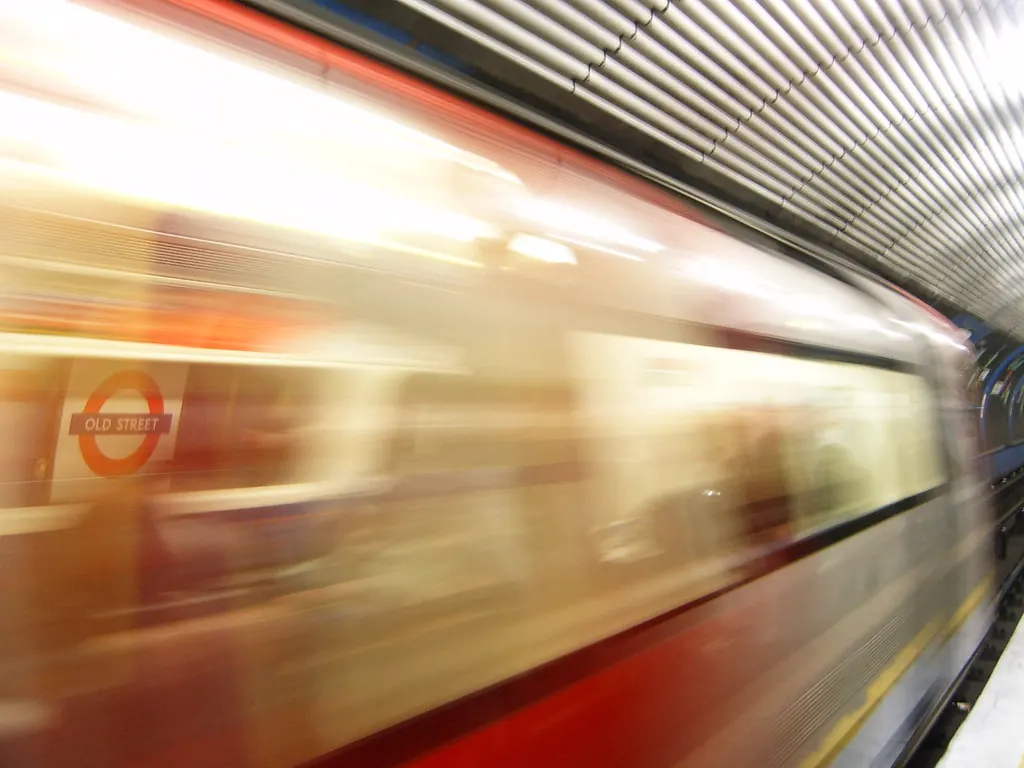
Transport for London (TfL) is the integrated transport authority responsible for London’s bus, Tube, tram, Docklands Light Railway, Elizabeth line, London Overground, cycling and walking networks, as well as the congestion charge, low emission zone and major roads. For anyone reporting on London’s urban environment – from housing and planning to public realm and air quality – TfL is an indispensable source of data, policy documents and service performance reports.
This reference page outlines the main ways to access TfL information, the types of datasets available, and how they can be used for transit, street and service-quality reporting. All details are based on TfL’s official website and open data portal. Since TfL regularly updates its data and reports, readers should always verify current information on the official sources.
The TfL Open Data Portal
TfL publishes a vast amount of data through its open data portal, available at tfl.gov.uk/info-for/open-data-users/. The portal is designed for developers, researchers, journalists and transport planners. It provides free access to hundreds of datasets covering:
- Real-time bus, Tube, tram and rail arrival predictions
- Live service status and disruptions on all modes
- Station and stop locations, including accessibility information
- Road traffic data, including journey times and flow counts
- Cycling infrastructure, including cycle hire station locations and availability
- Air quality monitoring data from roadside and background sites
- Timetables and routes for every public transport service
The data is available in multiple formats, including JSON, XML, CSV and GTFS (General Transit Feed Specification). TfL encourages use under its Open Data Licence, derived from the UK Open Government Licence.
Key Datasets for Urban Reporting
Below is a selection of TfL datasets that are especially useful for journalists and researchers covering London’s streets, transit and service quality. The table lists the dataset name, what it covers and how it can be applied.
| Dataset | Description | Typical Use |
|---|---|---|
| Unified API | Provides real-time arrivals, service status, line routes and stop points for all TfL modes. | Embed live transit info in maps or dashboards; track service delays across a network. |
| Journey Time Surveys | Historical and projected journey times by car, bus, cycle and walking for many routes. | Compare travel times across modes; analyse congestion trends over years. |
| Road Traffic – Live and Historical | Counts from traffic cameras and induction loops on major roads, plus speed data. | Identify peak-hour bottlenecks; evaluate the impact of roadworks or new cycle lanes. |
| Cycle Hire Locations | Real-time availability of bikes and docking spaces at each Santander Cycles station. | Map bike availability; analyse usage patterns by time of day or neighbourhood. |
| Air Quality Monitoring | Hourly readings of NO₂, PM₂.₅, PM₁₀ from TfL’s roadside and background monitors. | Link transport emissions to local air quality; support health or environmental reporting. |
This is not an exhaustive list. The open data portal also includes historical service performance, turnstile counts, public transport accessibility levels (PTALs) and asset inventories such as bus shelters and traffic signals.
How to Use TfL Data for Transit and Street Reporting
TfL’s data can power stories on service reliability, infrastructure investment and the user experience of London’s transport network. Here are a few practical scenarios:
- Service quality tracking: Use the Unified API to compare on-time performance across Tube lines over a week. The API returns a “disruption” field that can be aggregated to show which lines have the most unplanned delays.
- Street-level conditions: The road traffic data and journey time surveys allow you to measure how roadworks, new cycle lanes or LTNs (low traffic neighbourhoods) affect travel times. Because TfL publishes both historical and live data, you can build before-and-after comparisons.
- Accessibility reporting: The station and stop datasets include details on step-free access, escalators, lifts and tactile paving. Journalists can cross-reference this with the real-time status of lifts to identify stations that are frequently inaccessible.
- Air quality and transport: TfL’s air quality monitors are often located near major roads. By combining this data with traffic counts, reporters can illustrate the link between congestion and pollution spikes.
For all these uses, the open data portal provides API keys and documentation. TfL also offers a developer portal with tutorials and code examples.
TfL Reports and Publications
Alongside raw data, TfL publishes a range of regular reports and strategic documents that are essential for context:
- Travel in London – an annual report covering trends in travel demand, mode share, congestion and public transport usage.
- London Streets Performance Reports – quarterly updates on road safety, traffic flows, cycling and walking activity.
- Service Quality Reports – monthly or quarterly performance dashboards for each mode, including customer satisfaction scores and reliability metrics.
- Business Plan and Investment Proposals – multi-year plans outlining capital spending, new projects and service improvements.
These documents are all available on the TfL website under the “Corporate” or “Reports” sections. They provide the narrative and policy framework that raw data alone cannot convey.
Limitations and Practical Considerations
While TfL’s open data is extensive, there are some important limitations to keep in mind:
- Data freshness: Real-time feeds have a latency of a few seconds to a minute, but historical data may be updated irregularly. Always check the metadata for the last update date.
- Geographic scope: TfL data covers the Greater London area and some adjacent zones. For services outside London (e.g., National Rail trains or long-distance coaches), you need other sources.
- Licence requirements: The Open Data Licence requires attribution and does not allow re-licensing under restrictive terms. It is suitable for both editorial and non-commercial use.
- Technical skill: Some datasets require programming to query APIs or parse large CSV files. However, TfL also provides downloadable snapshots and pre-aggregated reports for non-technical users.
For the most accurate and up-to-date information on any specific dataset, refer to the official documentation on the TfL Open Data portal.
Sources and Limits
This reference page is based entirely on the following official sources:
- Transport for London – https://tfl.gov.uk/
- TfL Open Data Users – https://tfl.gov.uk/info-for/open-data-users/
All data availability, formats, licence terms and performance metrics described above are subject to change. Readers should consult the official TfL website and open data portal for the current status of any dataset or report. TfL does not endorse any specific journalistic use of its data, and users are responsible for ensuring compliance with the licence and data protection requirements.
Fuentes
- [{"name": "Transport for London", "url": "https://tfl.gov.uk/"}, {"name": "TfL Open Data", "url": "https://tfl.gov.uk/info-for/open-data-users/"}]
Historial de cambios
Ultima revision y actualizacion: 30 July 2026.
Latest related updates

The Urbanist seeks operations strategist for temporary role
The Seattle-based urbanism publication is recruiting for a project-based role running from January to July 2027. The vacancy has no direct London…
Read update
New book questions whether best-practice urbanism can create neighbourhoods with lasting character
Building Charm, by Smart Density founders Naama Blonder and Misha Bereznyak, argues that walkability, mixed use and higher density do not automatically…
Read update
Robotaxi expansion plan offers no confirmed London planning angle
Uber’s reported plan to expand robotaxi operations concerns San Francisco and Houston. The available source material does not establish a London policy,…
Read update
Seattle police oversight story falls outside the London beat
A report on Seattle policing, municipal budgets and surveillance does not establish a London planning, housing, transport or public-realm consequence and is…
Read update